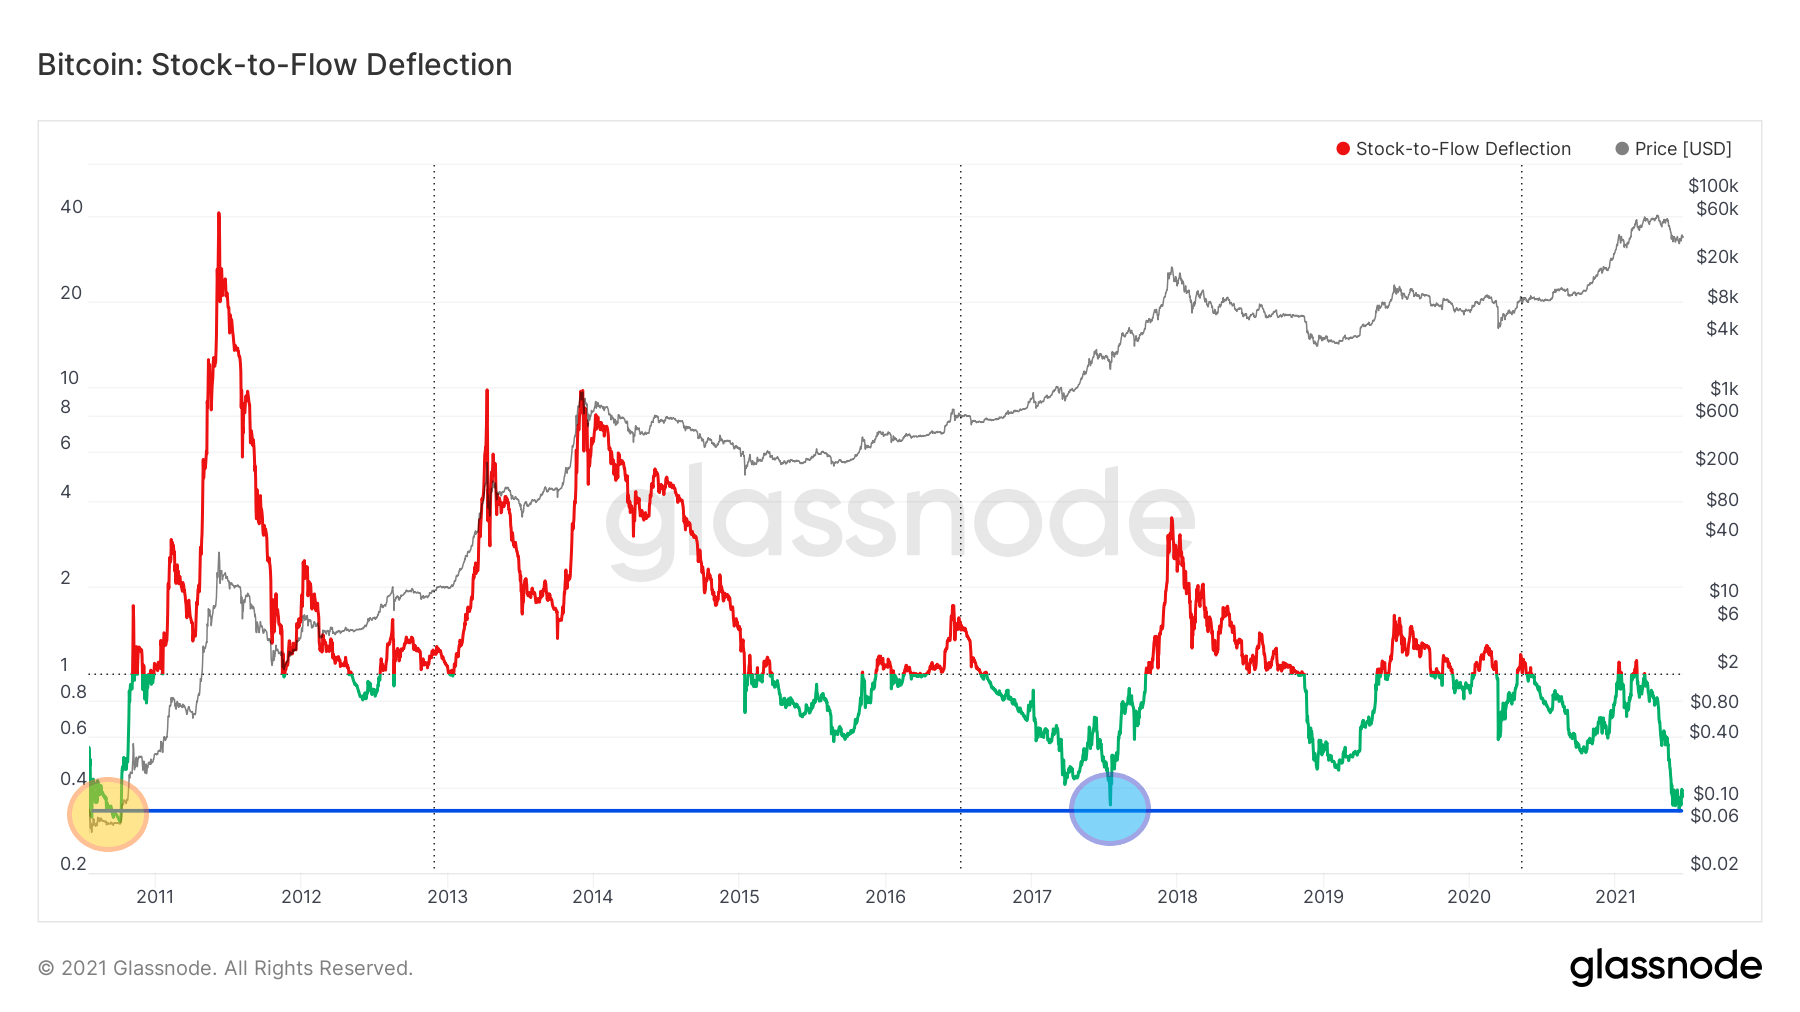
According to the stock-to-flow deflection chart, today, bitcoin is the most undervalued with respect to the last 10 years of its history.
A similar situation occurred in the middle of the 2017 bull market. After which, the BTC price continued its exponential growth.
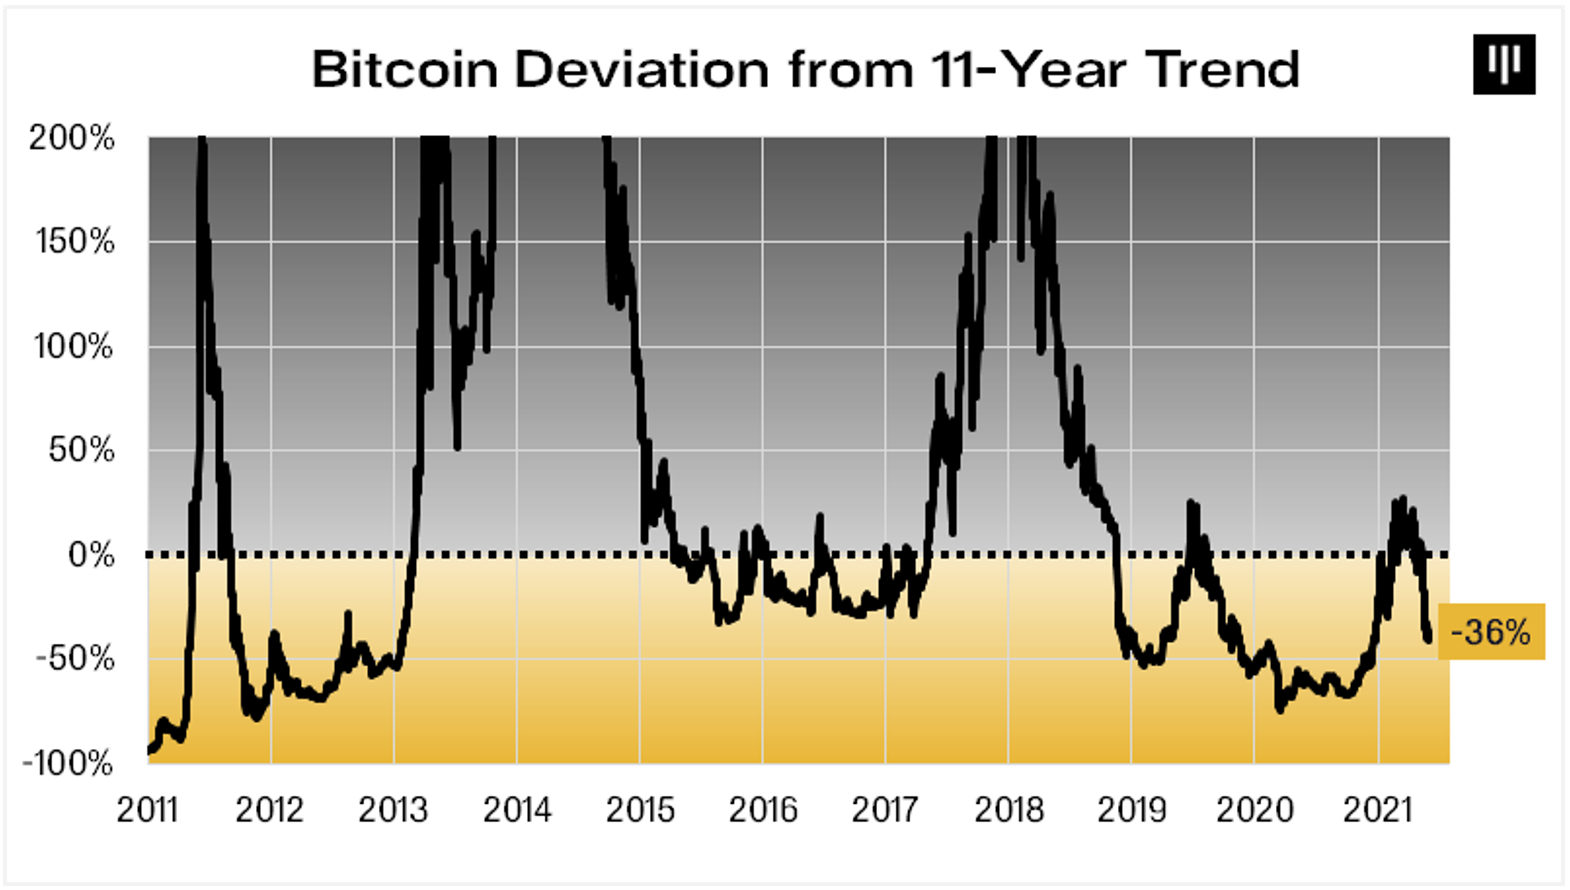
Additionally, bitcoin is deviating from its 11-year uptrend line. The deviation reaches 36% negative. This gives an additional signal that the value of BTC is undervalued and also shows room for upside. The peaks of previous bull markets led the major cryptocurrency high above this trendline.
Record deflection from stock-to-flowIn a recent tweet, cryptocurrency trader @CryptoMichNL pointed out that bitcoin’s price deflection chart from the popular stock-to-flow model is at its lowest level in over 10 years.
Today’s BTC price is oscillating around $40,000, while according to the model, it should already be slightly above $100,000.
The last time such a significant negative deviation occurred was in the early days of the network development. Back then BTC cost less than $0.1 in October 2010 (yellow circle).

BTC stock-to-flow deflection / Source: Glassnode
Moreover, the chart shows another moment in the history of the major cryptocurrency when the deflection almost touched current levels (blue circle).
This was in July 2017, in the middle of the previous bull market, when bitcoin cost around $2,000. A few months later, its price continued an exponential rise. This took it to the historical all-time high of $20,000 in December 2017.
The stock-to-flow deflection chart, therefore, not only gives a general indication of the relative value of BTC. It also provides an additional argument that the cryptocurrency market is in the middle of a long-term bull market.
This remains in line with a number of on-chain analysis indicators that are currently providing similar readings.
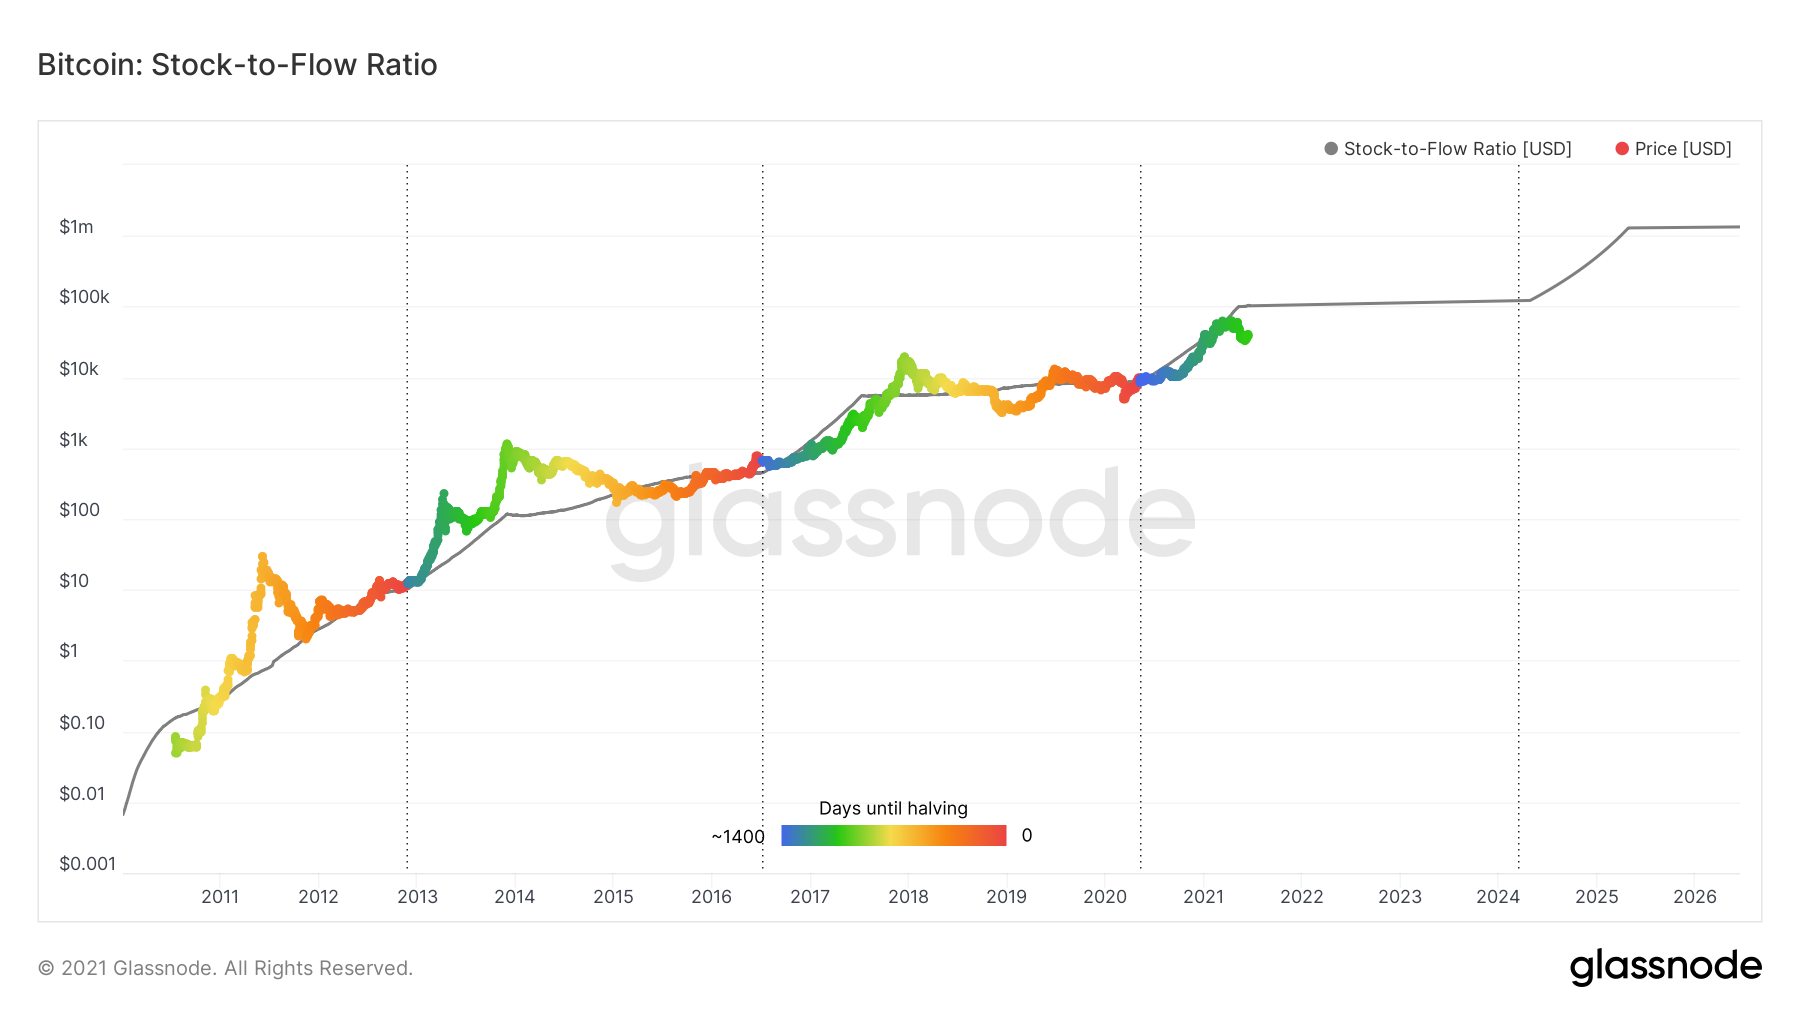
The stock-to-flow model popularised by @100trillionUSD reaches back to the now-classic book “The Bitcoin Standard” by Saifedean Ammous.
It expresses the relationship of stock, circulating supply, flow, or new production, of any asset whose quantity increases over time. For bitcoin, it is the circulating supply of coins in relation to newly mined coins.

Bitcoin stock-to-flow model / Source: Glassnode
The strength of this model lies in its historical effectiveness and its accounting for halving cycles (colors). So far, the BTC price has surprisingly followed the stock-to-flow model accurately, so it seems that it can be used to predict the future valuation of the largest cryptocurrency.
36% below the 11-year trendlineAnother crypto market participant and CEO of Pantera Capital, @dan_pantera, posted a chart on Twitter of the deviation of bitcoin’s price from its 11-year trend yesterday. It shows that the current price is 36% below the trendline.

Bitcoin deviation from 11-year trend / Source: Twitter
Additionally, the chart shows that throughout its history, the alpha cryptocurrency has only spent 20.3% of its time below the 0% level.
In retrospect, these were the best buying opportunities that later led to sizable gains. The undervaluation is also high, as the negative 36% level appeared several times in the current cycle. However, it never reached this point in the far less violent previous cycle of 2015-2017.
This again provides another argument that bitcoin’s behavior in the current cycle more closely resembles 2012-2013 than the previous bull market.
Disclaimer All the information contained on our website is published in good faith and for general information purposes only. Any action the reader takes upon the information found on our website is strictly at their own risk.PhD and an assistant professor at an international university in Lublin, Poland. Spent 10 years studying philosophy of nature and sport science. An author of 4 books and two dozens of scientific articles. Now, he is using his mind for the benefits of the cryptocommunity. Technical analysis enthusiast, Bitcoin warrior, and a strong supporter of the idea of decentralization. Duc in altum!


0 Comments