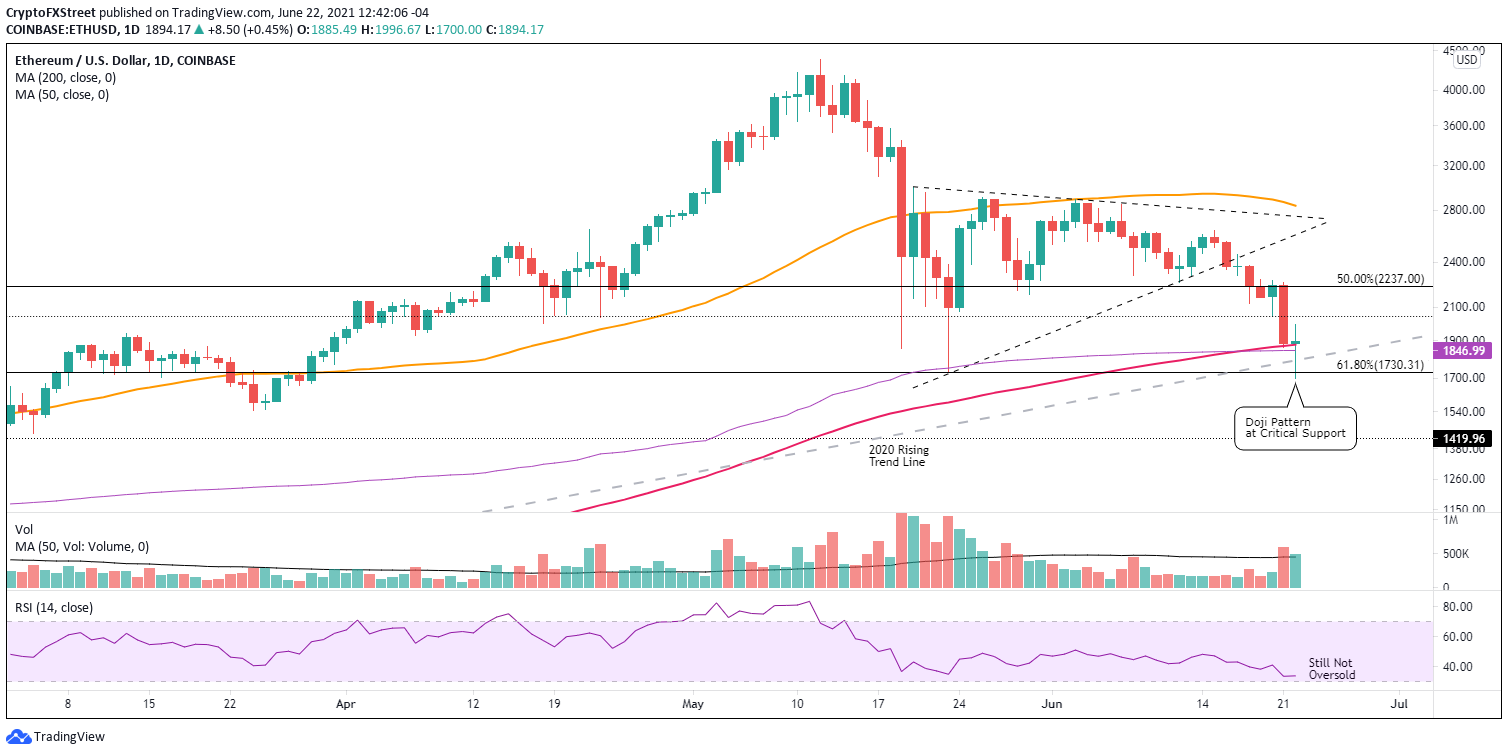
Ethereum price, like most altcoins, has fallen below the May 23 panic low as selling pressure gripped the cryptocurrency complex yesterday and earlier today. ETH now rests on the convergence of the 200-day simple moving average (SMA) and the anchored volume-weighted price (anchored VWAP), taking the form of a doji candlestick pattern. The current standoff expressed by the doji pattern may mark a reversal and an actionable low for skillful traders.
The positive response of Ethereum price to the notable support framed by the 200-day SMA at $1,878, the anchored VWAP at $1,847, the 2020 rising trend line at $1,793, the 61.8% retracement of the March 2020-May 2021 rally at $1,730 and the May 23 low of $1,728 creates a hint of optimism for eager ETH investors and speculators.
Adding some comfort is the potential doji pattern being defined on the daily chart, showing indecision on the side of both ETH sellers and buyers. It could also be interpreted as a reversal or the beginning of a consolidation range. Nevertheless, the doji pattern communicates that the early selling pressure was matched with spirited buying as the day has progressed.
The Ethereum price bounce is a marked improvement for the smart contracts giant, but it does not confirm that a sustainable low has been printed. Still, it may present a high probability opportunity for agile traders to initiate pilot buys with a target around the February high of $2,041, a crucial level of support during the April and May periods of ETH weakness.
Important upside resistance includes the 50% retracement of the March 2020-May 2021 rally at $2,237, representing an 18% return from the current price. If today’s low is sustainable, Ethereum price could target the symmetrical triangle’s lower trend line around $2,550, delivering a 35% gain from the current price.

ETH/USD daily chart
A daily close below the May 23 low of $1,728 would confirm that the current ETH selling has not been exhausted, and Ethereum price may fall to the 2018 high of $1,419, thereby ensuring an oversold condition on the daily RSI.
It is important to note that Ethereum price did draw a symmetrical triangle before breaking down on June 16. The measured move of the triangle pattern is approximately 43%, leaving ETH just below the 2018 high at $1,372.
Information on these pages contains forward-looking statements that involve risks and uncertainties. Markets and instruments profiled on this page are for informational purposes only and should not in any way come across as a recommendation to buy or sell in these assets. You should do your own thorough research before making any investment decisions. FXStreet does not in any way guarantee that this information is free from mistakes, errors, or material misstatements. It also does not guarantee that this information is of a timely nature. Investing in Open Markets involves a great deal of risk, including the loss of all or a portion of your investment, as well as emotional distress. All risks, losses and costs associated with investing, including total loss of principal, are your responsibility. The views and opinions expressed in this article are those of the authors and do not necessarily reflect the official policy or position of FXStreet nor its advertisers. The author will not be held responsible for information that is found at the end of links posted on this page.
If not otherwise explicitly mentioned in the body of the article, at the time of writing, the author has no position in any stock mentioned in this article and no business relationship with any company mentioned. The author has not received compensation for writing this article, other than from FXStreet.
FXStreet and the author do not provide personalized recommendations. The author makes no representations as to the accuracy, completeness, or suitability of this information. FXStreet and the author will not be liable for any errors, omissions or any losses, injuries or damages arising from this information and its display or use. Errors and omissions excepted.
The author and FXStreet are not registered investment advisors and nothing in this article is intended to be investment advice.


0 Comments